These are the steps to creating a new report. For this example, we’ll create a report about video starts by using Video Title and Events. Different reports will use different dimensions, metrics and filters:
https://app.screencast.com/KQwbmWLYwHKNn
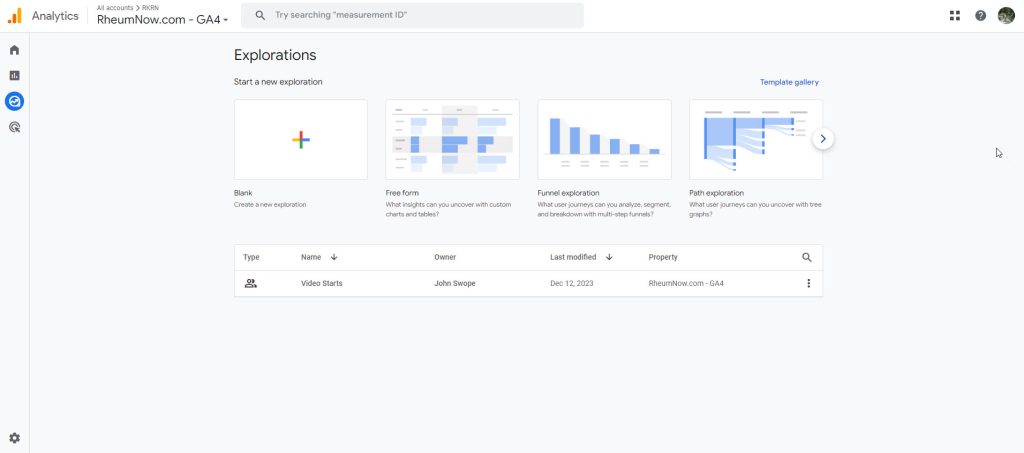
Step 1
Go to Google Analytics > Go to Rheumnow.com – GA4 account > click Explore.
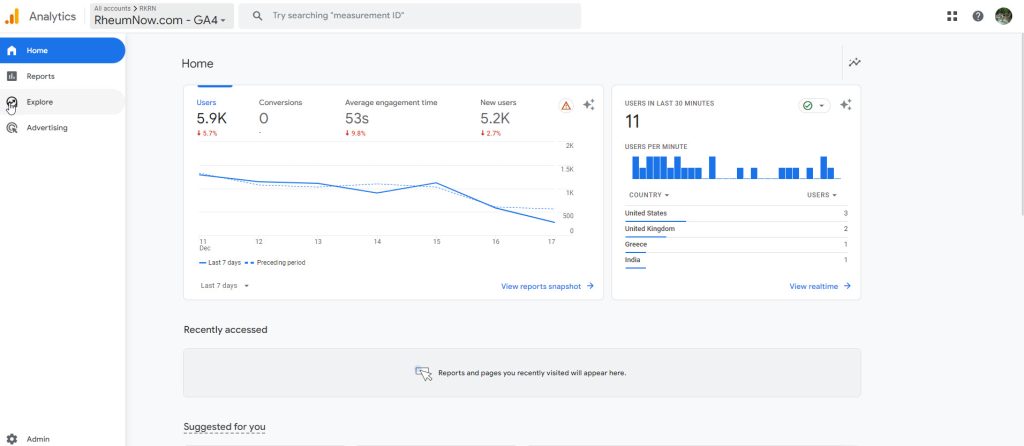
You will see all the reports that you’ve made and you’re shared with.
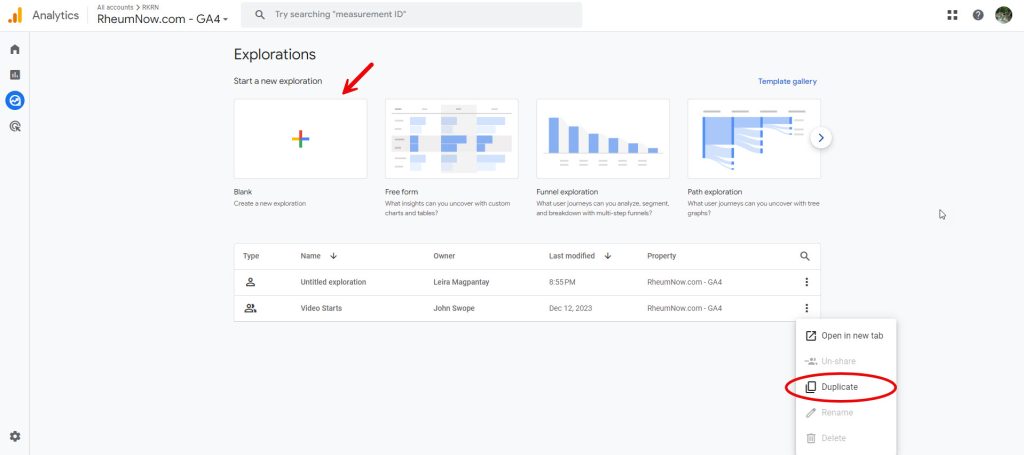
Step 2
To create a new exploration, you can either duplicate the old report or start a new exploration.
Step 3
Add the Title/Exploration Name.
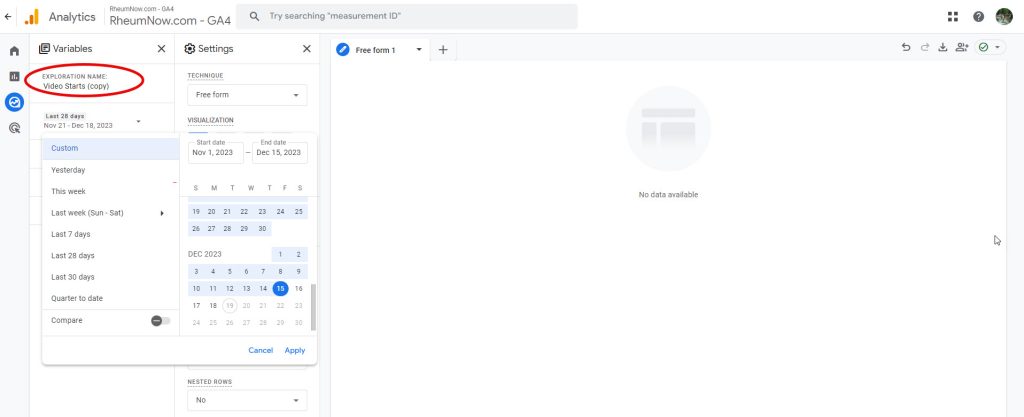
Step 4
Put in the time frame by clicking Custom date.
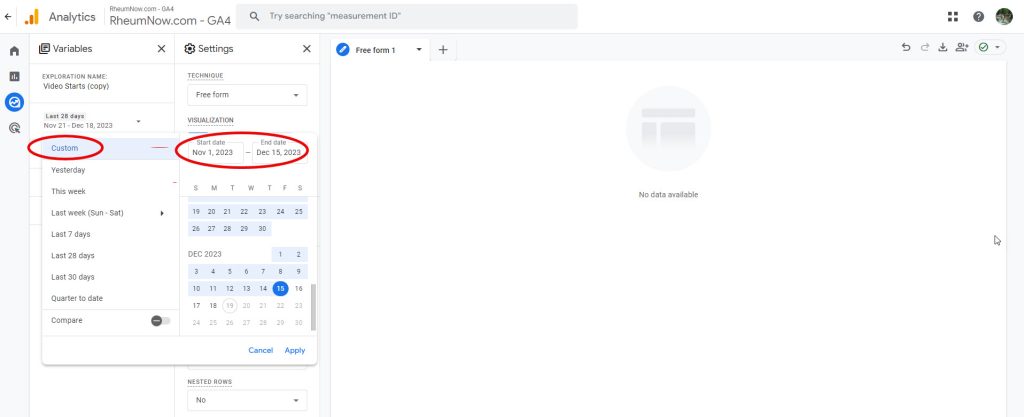
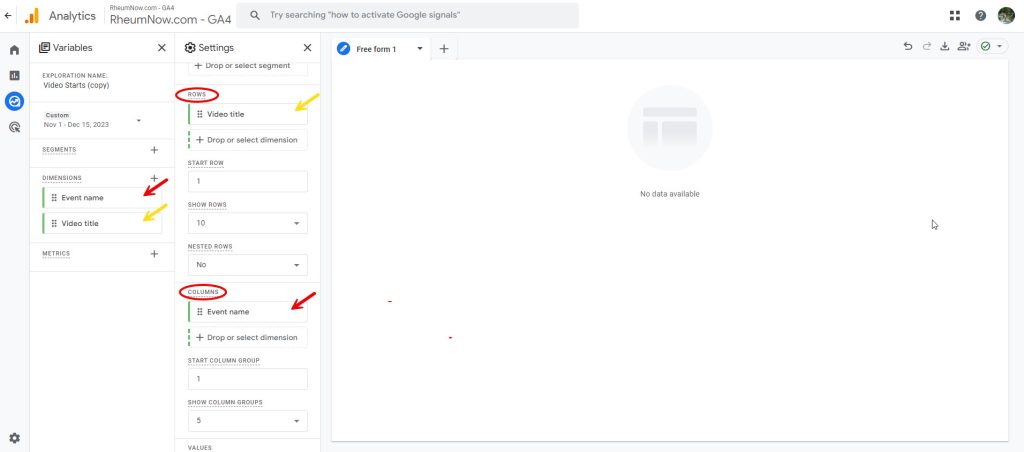
Step 5
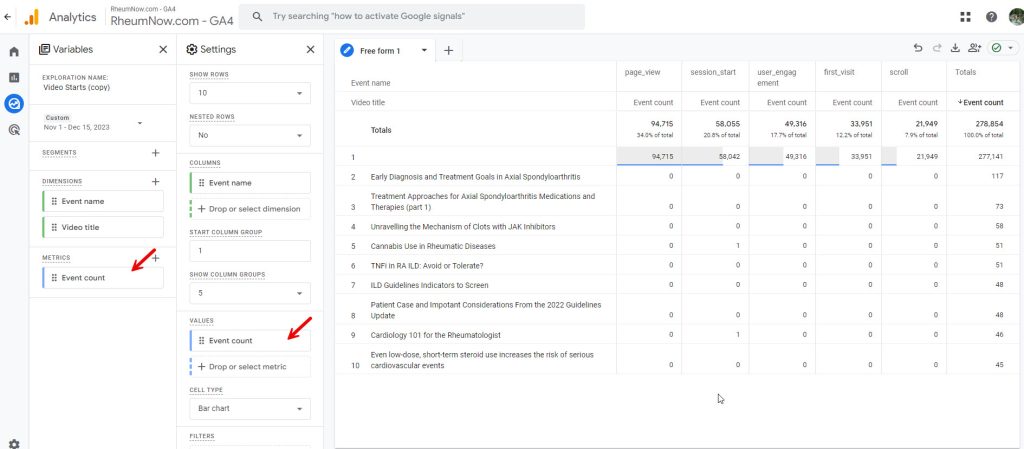
Add Dimensions.
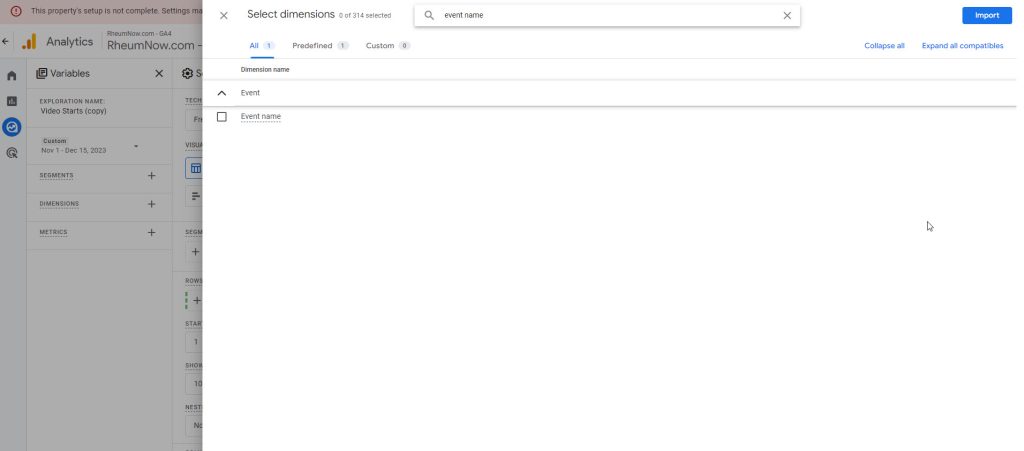
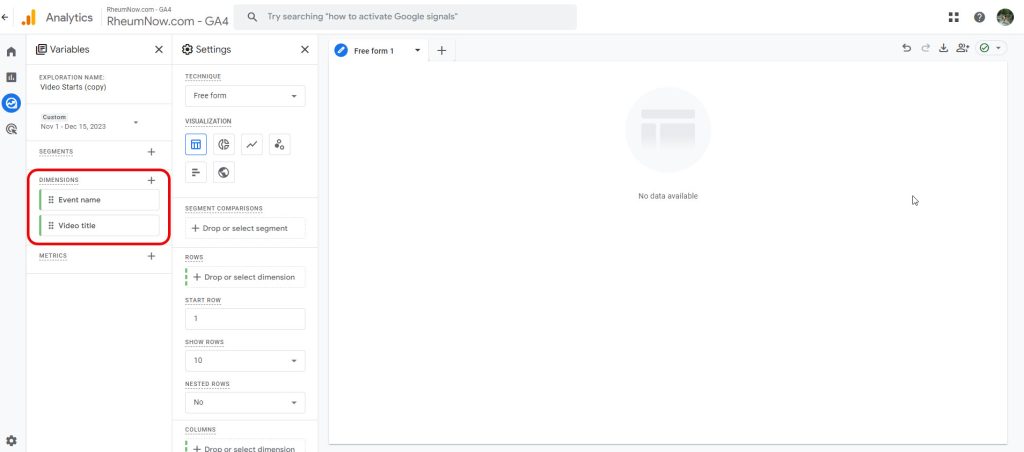
Drag Dimensions to where you want to set it.
Step 6
Add Metrics.
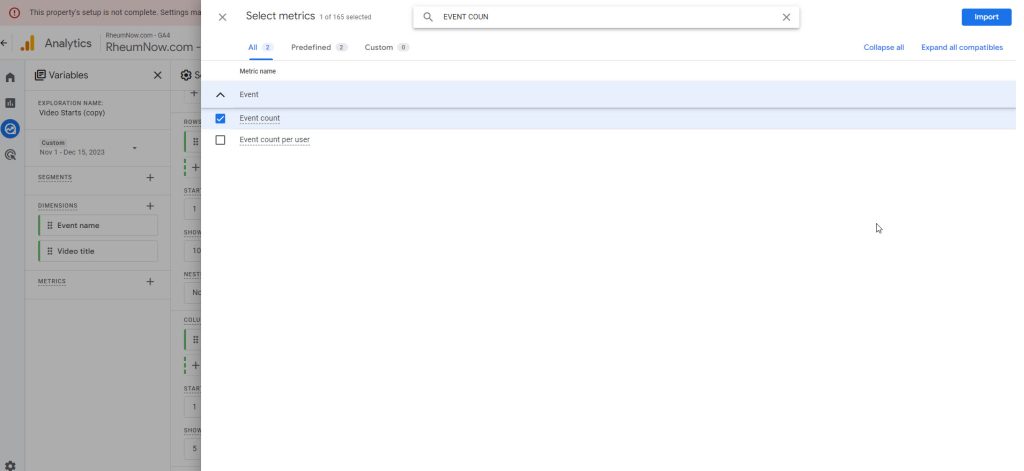
Drag the Metrics you want into Values to add it to the report.
Step 7
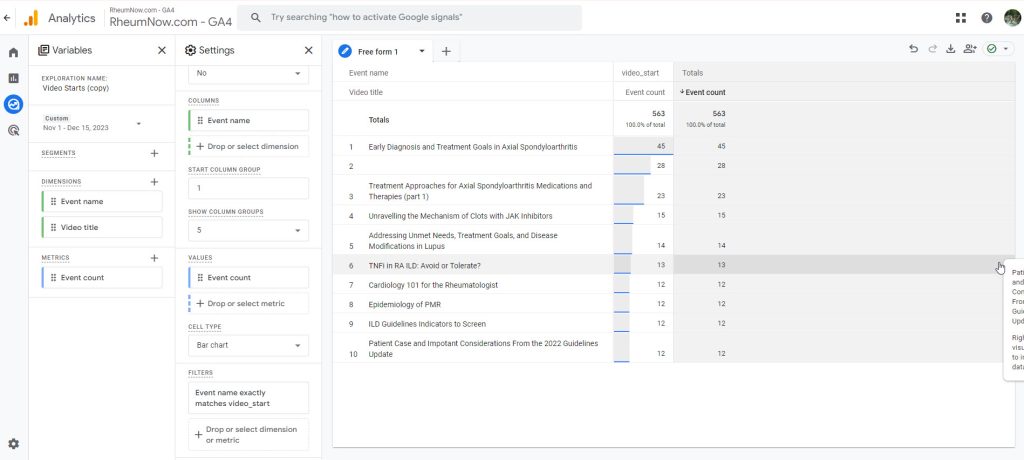
You can filter your dimensions, for example to filter your Event name to only include “video_start”.
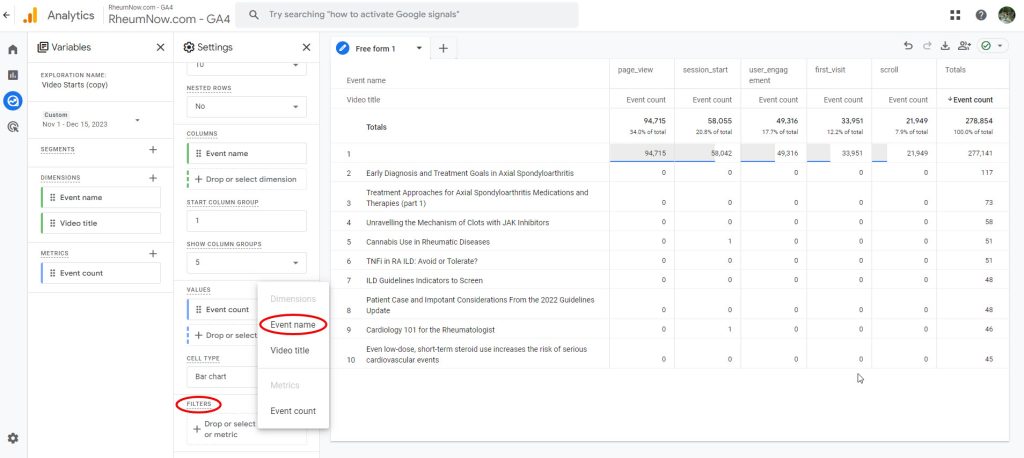
That will give you all the starts for those videos in that particular time frame.
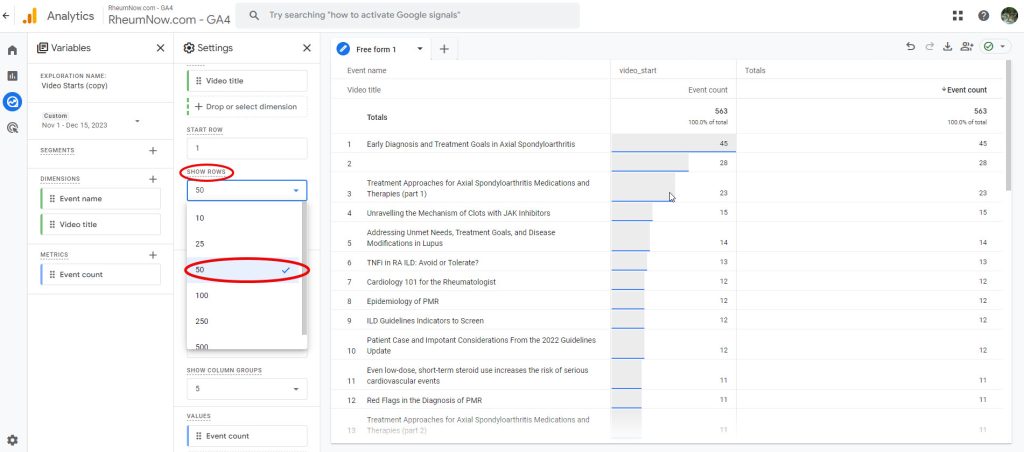
Step 8
You can show more rows if you wanted more.
Note: The only limit is that you have to figure out something that is common between all the video types.